
PharmaSUG Single Day Event
Tokyo, Japan
December 8, 2022
Effective Data Visualization for Decision-Making
The 5th annual PharmaSUG Japan SDE was held as a hybrid event this year, and was quite successful! Presentations are available from the links below. Many thanks to our sponsors and conference committee, and we'll see you in 2023!
2018年より本邦で開催しているPharmaSUG Japan SDEも,今年で5回目の開催となりました。 今年は3年ぶりにSAS Japan本社でのF2F開催ならびにZoom配信のハイブリッドで実施致します。
今年は「意思決定における効果的なデータの可視化」をテーマに,データの可視化の有用性ならびに製薬業界における利用事例を紹介致します。SAS,R/RShiny, Spotfireなど,複数の可視化のアイディアを共有予定です。
開催概要:
PharmaSUG Japan Committee 一同
今年は「意思決定における効果的なデータの可視化」をテーマに,データの可視化の有用性ならびに製薬業界における利用事例を紹介致します。SAS,R/RShiny, Spotfireなど,複数の可視化のアイディアを共有予定です。
開催概要:
- 日程:2022年12月8日 13:00-17:15 (12:30 開場)
- 開催:SAS Japan 本社(六本木ヒルズ 11F) / Zoom webinar
- なお,昨今の状況を踏まえ現地参加の人数は上限を108名とさせて頂きます。
- コロナの感染状況によってはZoom配信のみとなる可能性がございます。開催形式について変更がある場合,11月下旬に改めてご連絡致します。
- 参加費:無料
PharmaSUG Japan Committee 一同
Sponsored by:
 |
 |
||||
 |
|||||
Thursday, December 8, 2022 Single-Day Event Presentations
Presentation Abstracts
Building Business Intelligence Using Sales and Marketing Data and its UtilizationRyuichi Katsuragi, Shionogi & Co., Ltd.
Shinichi Fukunaga, Shionogi & Co., Ltd.
Yoshitake Kitanishi, Shionogi & Co., Ltd.
In order to increase the sales of our own products, which is the most important issue in the sales and marketing field, it is necessary to make decisions on what kind of information should be provided to which clients and when to do so. Therefore, by using various systems and digital channels in the sales and marketing area to visualize sales activities and customer status, we provided information that would be input for decision making. This BI tool contains the sales results and trends of each customer, alerts implemented using a unique algorithm, the status of implementation of recommended activities, and the status of information disclosure to customers, which can be used to inform the planning of activities for clients. As a result, we saw changes in sales activities, such as an increase in the number of issues identified and an increase in activities recommended as effective. In this session, we will introduce the usefulness of data visualization in the field of Sales and Marketing, the know-how we have acquired, and also describes future perspectives.
Back to top
Introduction to Real-World Data in Japan
Takashi Misawa, Japan Tobacco Inc..
RWD is expected to have a wide range of applications from preclinical to LCM. However, RWD in Japan has limitations in terms of age, traceability, etc. It is necessary to understand these limitations and select an appropriate RWD according to a research question. In addition, the large size of the data makes it difficult to understand the characteristics of RWDs. In this session, I would like to explain the characteristics of RWD in Japan and help you select an appropriate RWD. Furthermore, examples of visualization to understand the characteristics of RWD will be presented.
Back to top
Role of Visualization in Supporting Efficient Workflows across the Life Cycle of Drug Development
William Kuan, SAS Institute Japan Ltd.
Drug development life cycle includes the steps from strategy development, research and early development, clinical development, regulatory approval to market access and post-marketing monitoring. In addition to traditional clinical trial analyses, the business needs of advanced analytics capabilities (e.g., machine learning, natural language processing) are required with the growing attention on real-world evidence and decentralized clinical trials in pharmaceutical industry. Data visualization is an effective way to help decision making. However, the role of visualization is not only supportive of presenting the analysis results, but also helpful in the process of analyzing the data, especially for users with different level of analytical skills. We discuss here how visualization can support efficient workflows and data-driven decision across the life cycle of drug development using the end-to-end analytics platform SAS Viya and industry solution SAS Health.
Back to top
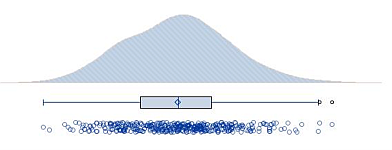
Implementation of Raincloud Plot with SAS and Its Use for Clinical Trial Data
Yutaka Morioka, EPS Holdings, Inc.
Raincloud plot is a recent visualization method for univariate data invented by Prof. Micah Allen at Aarhus University. Raincloud plot is a method that combines following three plots and help us to understand data.
- Violin plot (Cloud): Distribution of data using kernel density estimation
- Box-and-whisker plot (Umbrella): Quantile summary and outliers
- Strip plot (Rain): Individual data values as they are
Back to top
Leveraging of Data Visualization in Eli Lilly
Masataka Higashijima, Eli Lilly Japan K.K.
Data Visualization is not just a tool for statisticians and programmers. Rather, it is a tool that facilitates access to data by non-statisticians such as clinical, safety, and medical writers, and through interactive communication to gain new insights from the data and make more effective team decisions. In recent years, there are discussions around the world about the various uses of Data Visualization in the pharmaceutical field, and its usefulness is beginning to be recognized. In this session, we will introduce examples of Data Visualization used at Eli Lilly and share how Data Visualization contributes to decision-making within the company.
Back to top
PMS Data Visualization by Spotfire
Takayoshi Sasajima, Novartis Pharma K.K.
Eri Sakai, Novartis Pharma K.K.
Post-marketing surveillance (PMS) data is collected under clinical practice, and data cleaning is not enough compared to clinical trials. These data sometimes cause queries in late stage or even re-analysis after database lock. Therefore, it is important for PMS team members to check PMS data regularly and ensure its quality. We provided Spotfire to visualize PMS data interactively without programming skills. Through data-visualization by Spotfire, team members can detect irregular data which may impact on the analysis. In addition, they can also understand the current clinical practice through PMS data and obtain some insights from the visualized format. In this session, we will share how the data-visualization helps to increase the efficiency and effectiveness in our PMS project.
Back to top
Introduction of BEAMS (Business Efficiency Acceleration for Medical Data Review with Spotfire) Project
Shigeyuki Furuta, Chugai Pharmaceutical Co., Ltd.
Musashi Ishiguro, Chugai Pharmaceutical Co., Ltd.
BEAMS (Business Efficiency Acceleration for Medical Data Review with Spotfire) is a project in Chugai Pharmaceutical Co., Ltd. to introduce Medical Data Review tool used in F. Hoffmann-La Roche Ltd. into Chugai. The review using the tool enables medical data review from the same perspective as Roche and supports the PoC review and early license out of new medicines to Roche, which is one of Chugai's business models.
The tool has approximately 40 sheets and 150 visualizations using Spotfire, contributing to reading trends in the time to onset of drug effect and its degree, detecting new safety signals and shortening the time for preparing materials for cohort transition meetings. Providing rich and useful Spotfire visualizations enables dynamic reviews and has been highly evaluated by users in terms of operability. Also, by embedding Python in the tool, 70% to 80% of the construction work could be automated when creating the visualizations.
Back to top
Presenter Biographies
Shinichi FukunagaShinichi Fukunaga is Director of the Data Science Department at Shionogi & Co., Ltd, and has been visualizing and analyzing data related to sales areas and building a database.
Shigeyuki Furuta
Shigeyuki Furuta is a Study Data Manager in Chugai Pharmaceutical Co., Ltd. He has been engaged in DM work in clinical trials for about 15 years. Also, he has experience in EDC setting and data cleaning with Medidata Rave, and also in SAS programming and data listing creation with Spotfire.
Masataka Higashijima
Masataka Higashijima is a research scientist at Eli Lilly Japan K.K. He has about 18 years' experience in the pharmaceutical industry, including information technology expert, data management/statistical programmer, and statistician. He has held roles recently in building a database from clinical study with CDISC standards. Also he is engaged with standardization and automation of work.
Musashi Ishiguro
Musashi Ishiguro is a System Engineer for Data Management & Statistical Programming in Chugai Pharmaceutical Co., Ltd. He has built 30+ studies on Medidata Rave and supported electronic data submissions, and has been administrating several systems related to Clinical Development.
Ryuichi Katsuragi
Ryuichi Katsuragi has been working for Shionogi for 5+ years. He had worked at Sales and Marketing Department, before. Now, he belongs to the Data Science Department and has been visualizing and analyzing data related to sales areas and building a database.
Yoshitake Kitanishi
Dr. Yoshitake Kitanishi, Vice President, Head of Data Science Department, Shionogi & Co. Ltd. has been using SAS/R/Spotfire for15+ years and Matlab / Python for 5+ years.
William Kuan
William Kuan is an Industry Consultant in EMEA & APAC Health and Life Sciences team at SAS. Prior to joining SAS in 2021, he worked as a health economic and outcome research (HEOR) specialist at IQVIA and Syneos Health in Japan. William is excited to help SAS growing SAS solutions within the health care and life sciences industry and to provide customer advisory support to health care, life sciences and health care government customers.
Takashi Misawa
Takashi Misawa is a Market Researcher in clinical development at Japan Tobacco Inc. His responsibilities are business feasibility assessments, and analytical support using RWD.
Yutaka Morioka
A SAS programmer based in Japan. Besides my work as a clinical data scientist, actively engaging in disseminating various SAS programming techniques from introductory level to advanced. Having posted SAS programming blog entries since 2013 (http://sas-tumesas.blogspot.com/) and experienced numerous times of presentations in seminars and SAS users meetings. Total 12 years of working experience in Japanese CRO industry analyzing the data of clinical studies. Additional 2 years experience as an analyst predicting election results and summarizing mass social surveys.
Eri Sakai
Eri Sakai works as a Statistical Programmer for Novartis K.K. since October 2019. Before that, she used to work in Data Science group at SHIONOGI & Co., Ltd. She is working for new drug development and PMS (Post Marketing Survey) projects primarily.
Takayoshi Sasajima
Takayoshi Sasajima has worked for Novartis K.K. for 9 years as a Biostatistician. Previously, he worked in statistical group at a CRO company. He works for new drug development and post-launch (post-marketing surveillance) projects.